

One of the awesome things about a security-focused interception proxy like ZAP is its ability to passively detect flaws by examining traffic. This reduces the cognitive load for the tester to identify a lot of common issues that are plainly observable just by analyzing the regular traffic.
Viewing Alerts in the ZAP Desktop Application
The bottom pane of the app, where the History is, also has a tab for Alerts.
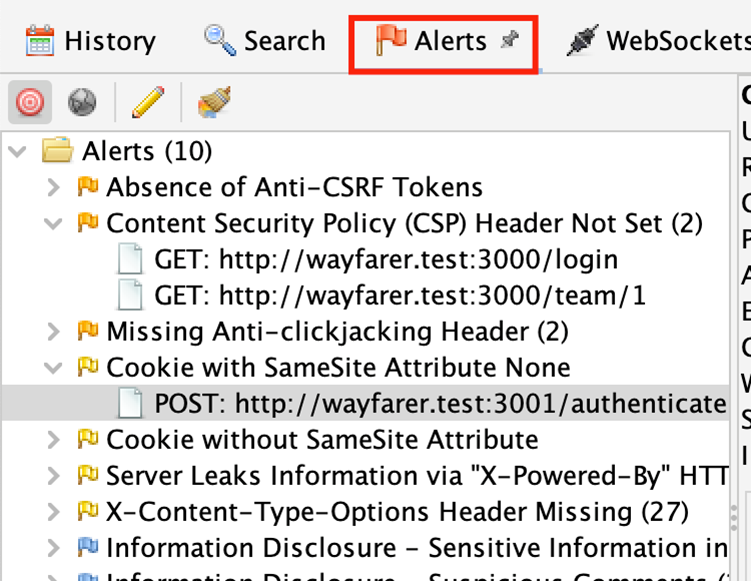
If you review this, you'll see entries for different issues that have been discovered by analyzing the traffic ZAP has captured. This is a more useful view when limited to In-Scope items, which I have done in the above image. Selecting an individual item will display information about the flaw, including where it was found, the risk it poses, a description, and suggested solution. The Source field indicates where it was populated from. My example below is Passive, meaning it simply analyzed the traffic that I proxied through ZAP (in contrast to tools like the Scanner, which construct and send malicious requests to discover flaws). It's worth noting that while ZAP provides a Risk rating, it doesn't really understand business rules or context, so you probably want to treat that as just a suggestion. We have a Knowledge Center article discussing how we determine risk levels of findings, if you want to go deeper into this topic.
-Apr-10-2023-07-01-43-8936-PM.webp)
The alerts also have references to the request and response pairs showing the issue. You can browse these by expanding the individual alert node on the tree.
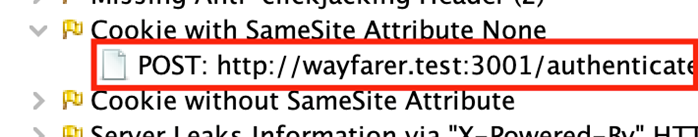
If you select one of these entries, the associated Request and Response will be displayed in the usual place on their respective tabs in the upper-right pane of the main ZAP window.
Using the HUD (or Not)
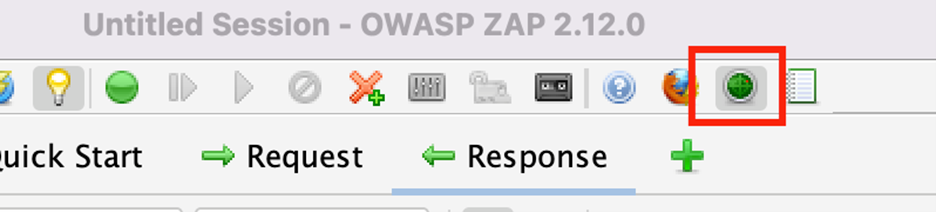
ZAP's HUD is a UI that the proxy injects into the page you're browsing. If you've been following along, you might have already seen it. If you need to enable it, you can do so with the button that looks like a green radar display on the main toolbar of the ZAP desktop app.
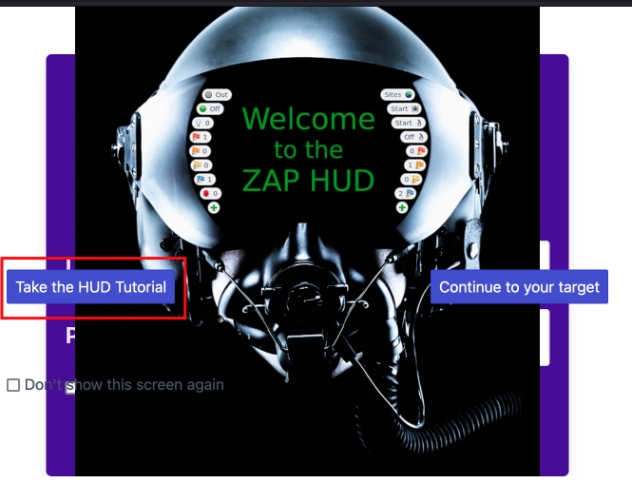
Now, when you load a page in your proxied browser, you'll see the HUD. You might initially see the splash screen for it which also has a link to its own tutorial.
You'll immediately see that it shows the Alerts in an overlay on the page, with the red, orange, yellow and blue flag icons on either side. The left side is for the particular page you're on, the right side is for the site. There's some request editing and replay functionality available if you click the History button at the bottom. I would also note that the HUD will create its own context and seems not to pick up the scope until you add the page to the scope through the HUD's UI (the target icon at the top-left side of the overlay).
It's worth knowing that the HUD is there and is an option. I personally tried it and then quickly moved away from using it. Its interfaces were generally inferior to the ZAP Desktop App. It had buttons to kick off automated tools, but I didn't see a way to do fuzzing from it. I also found that it broke the apps it injected into (and itself, at times). It's an interesting idea, and your mileage may vary with it. I'm sure it will become more robust in future iterations of the tool.
In Summary
The alerts pane is worth looking at, especially after you've mapped the application's functionality and set up your scope. The HUD is a neat option, but I would personally advise turning it off.
Want a deeper assessment than passive scanning provides?
Automated alerts are a starting point. Our penetration testers dig into business logic, authentication flows, and complex attack chains that tools miss. Reach out to discuss a security assessment.
Talk to Our Team