Overview
I recently had a friend that wanted to learn how to use a logic analyzer. Given the number of applications available for the Flipper Zero, I anticipated there might be some promising targets worth studying. One that I found was the Sentry safe exploit FAP by Etienne Sellan, aka Hackd4ddy, who has done some amazing research on this topic and provided an excellent write-up here. He also attempted to produce a hardware/firmware fix for it here. After conducting a walkthrough on this for a friend in-person as a nice and easy introduction to using a logic analyzer, I figured it would make a nice blog post as well for those looking for an introduction to the topic of logic analyzers.
It’s also not a bad idea to review how an exploit works before using it in the real world. Ideally, you will want to make sure you understand what the exploit is doing, how it works, and be aware of any unintended consequences of the exploit. We do this with proof-of-concept exploit code, and I see no reason why hardware exploits should be treated any differently.
Cursory Review of the Flipper Zero Sentry Safe FAP
On my Flipper Zero, I’ve installed the Xtreme Firmware. On top of an amazing UI overhaul and quality of life changes, it also ships with many FAPs installed by default. One of these FAPs was the [GPIO] Sentry Safe FAP. This FAP can be used to open up certain models of the Sentry and Master Lock safes that use electronic keypads. This also ships standard on a lot of other non-factory firmwares for the Flipper Zero.
Even if you are on the factory firmware, you can easily obtain this FAP using the Flipper Zero mobile companion app. This application now contains a FAP store that can be used to install FAPs to the Flipper Zero over Bluetooth using your phone. Searching the FAP store for Sentry Safe returned the FAP, as shown in the screenshot below, so factory firmware users can install it.
![Screenshot of the [GPIO] Sentry Safe Fap in the Flipper Zero Mobile Application](https://www.secureideas.com/hs-fs/hubfs/Untitled-png.png?width=1080&height=1381&name=Untitled-png.png)
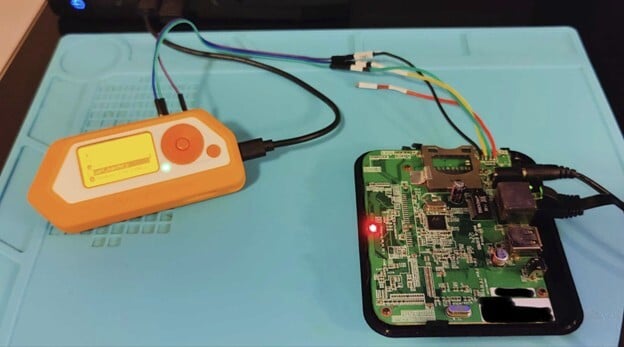
When starting the FAP, it will provide a very minimalistic UI screen that provides an explanation of the wiring and a prompt to click OK when you want to open the safe. The wiring is pretty minimal, with just two wires. It expects a connection to ground from the flipper to connect to the black ground wire on the safe’s keypad, so they share a common ground. The second wire should connect the C1 pin on the Flipper Zero’s GPIO pins to the green wire on the safe’s keypad. The screenshot below shows the UI screen for this part of the process.
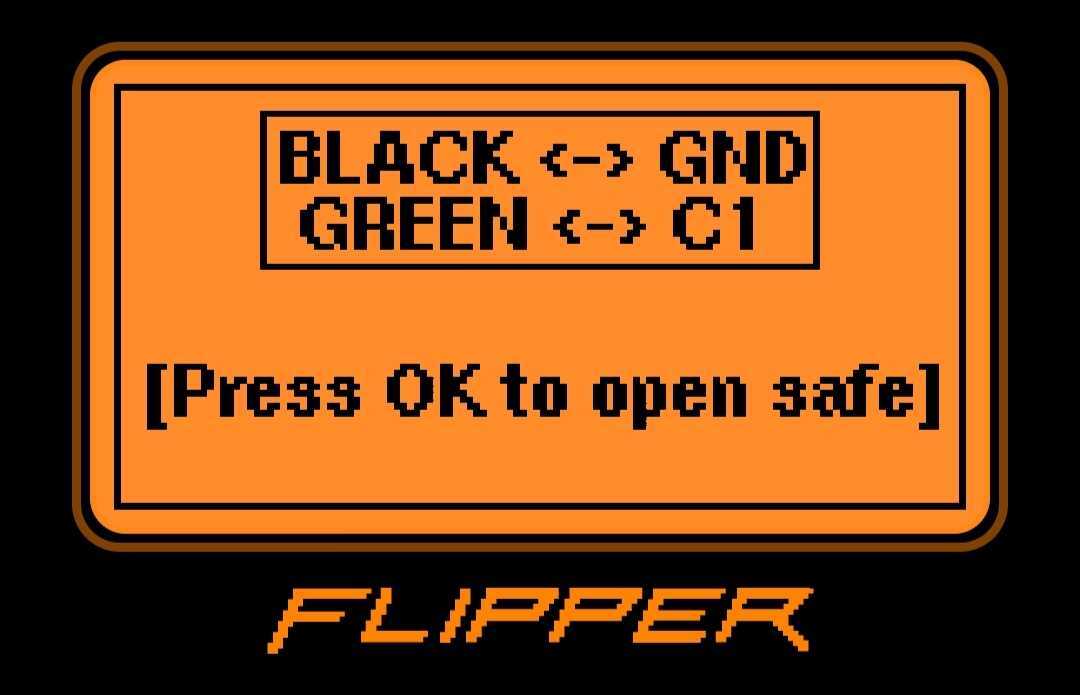
Without even hooking up any wires, clicking the OK button will cause the screen to flip over to another screen that reports Done!, as shown in the following screenshot.

From this behavior alone, we are able to determine that this is a one way communication. The application only has one wire for communication and reports Done, despite not being hooked up to anything. This means the application is likely sending data and not reading anything, so it’s blind. However, we can find videos of this online where the exploit is shown to work, so it is effective and should work on vulnerable units. We also have the source code and an excellent write-up to accompany case study.
So without further ado, let’s attempt to analyze this exploit ourselves. To capture and understand this exploit, we will need a blend of hardware and software solutions.
Hardware for Capturing the Exploit
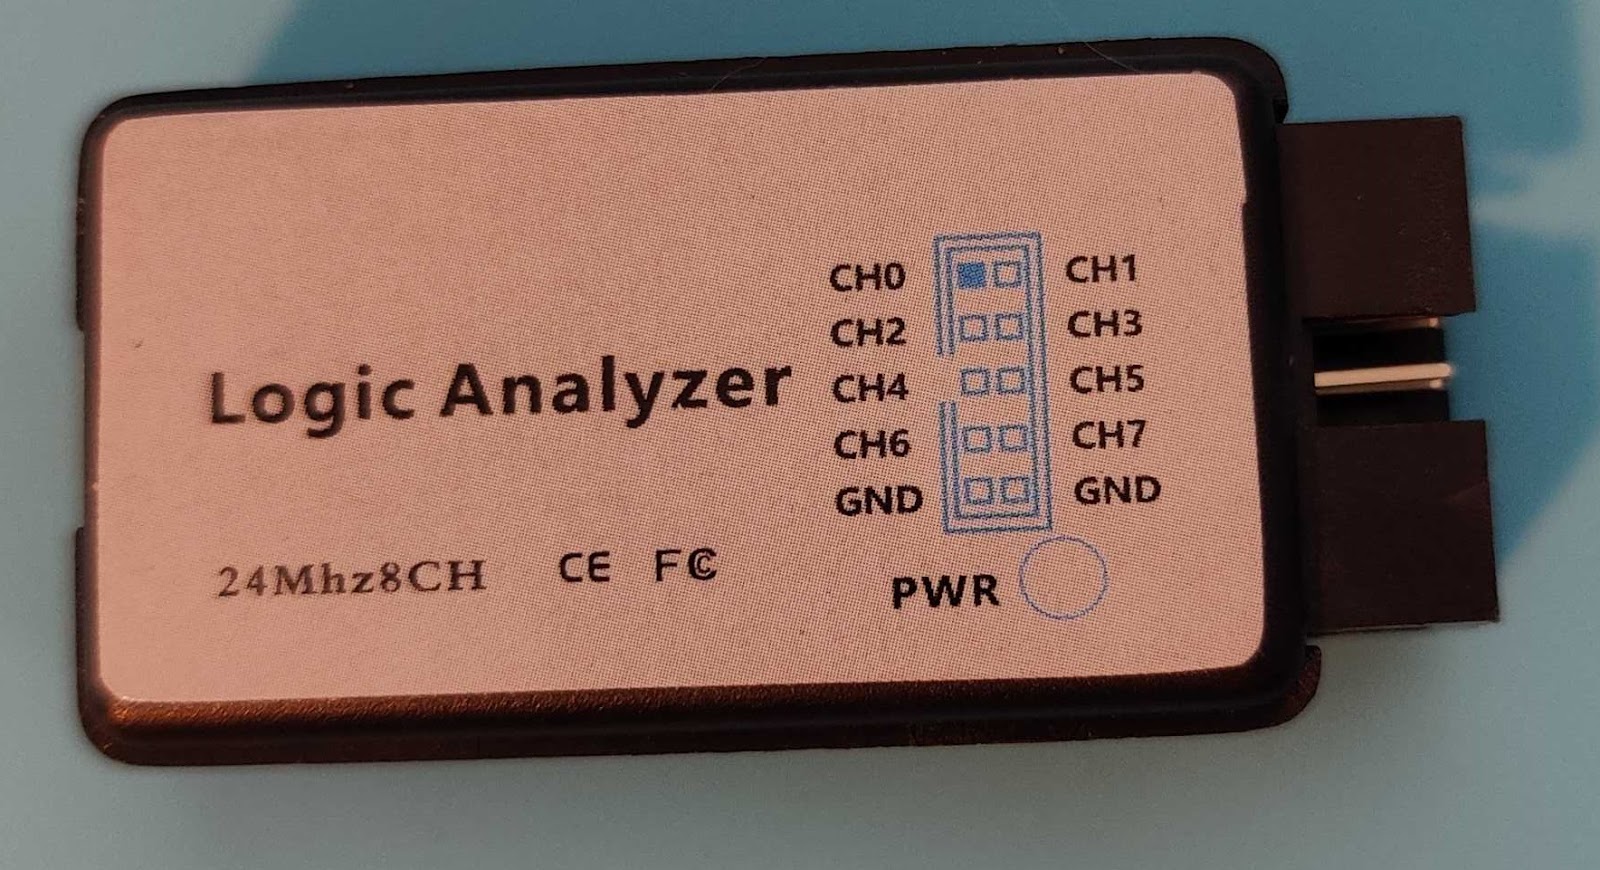
This exploit works in the real world with a physical connection to the safe. Since this is transmitted over physical wires, we will need something that allows us to capture that information. In our normal domain as IT security professionals, we usually transmit data over NICs and that is the hardware that can capture the data as well. However, in this case we will need a logic analyzer. These can range in price from really cheap to breaking the bank expensive. For this example, we can get away with a low-cost, off-brand option from Amazon or Aliexpress. The photo below shows an inexpensive 8 channel logic analyzer I used for this example, costing around $10-$15 USD on Amazon.
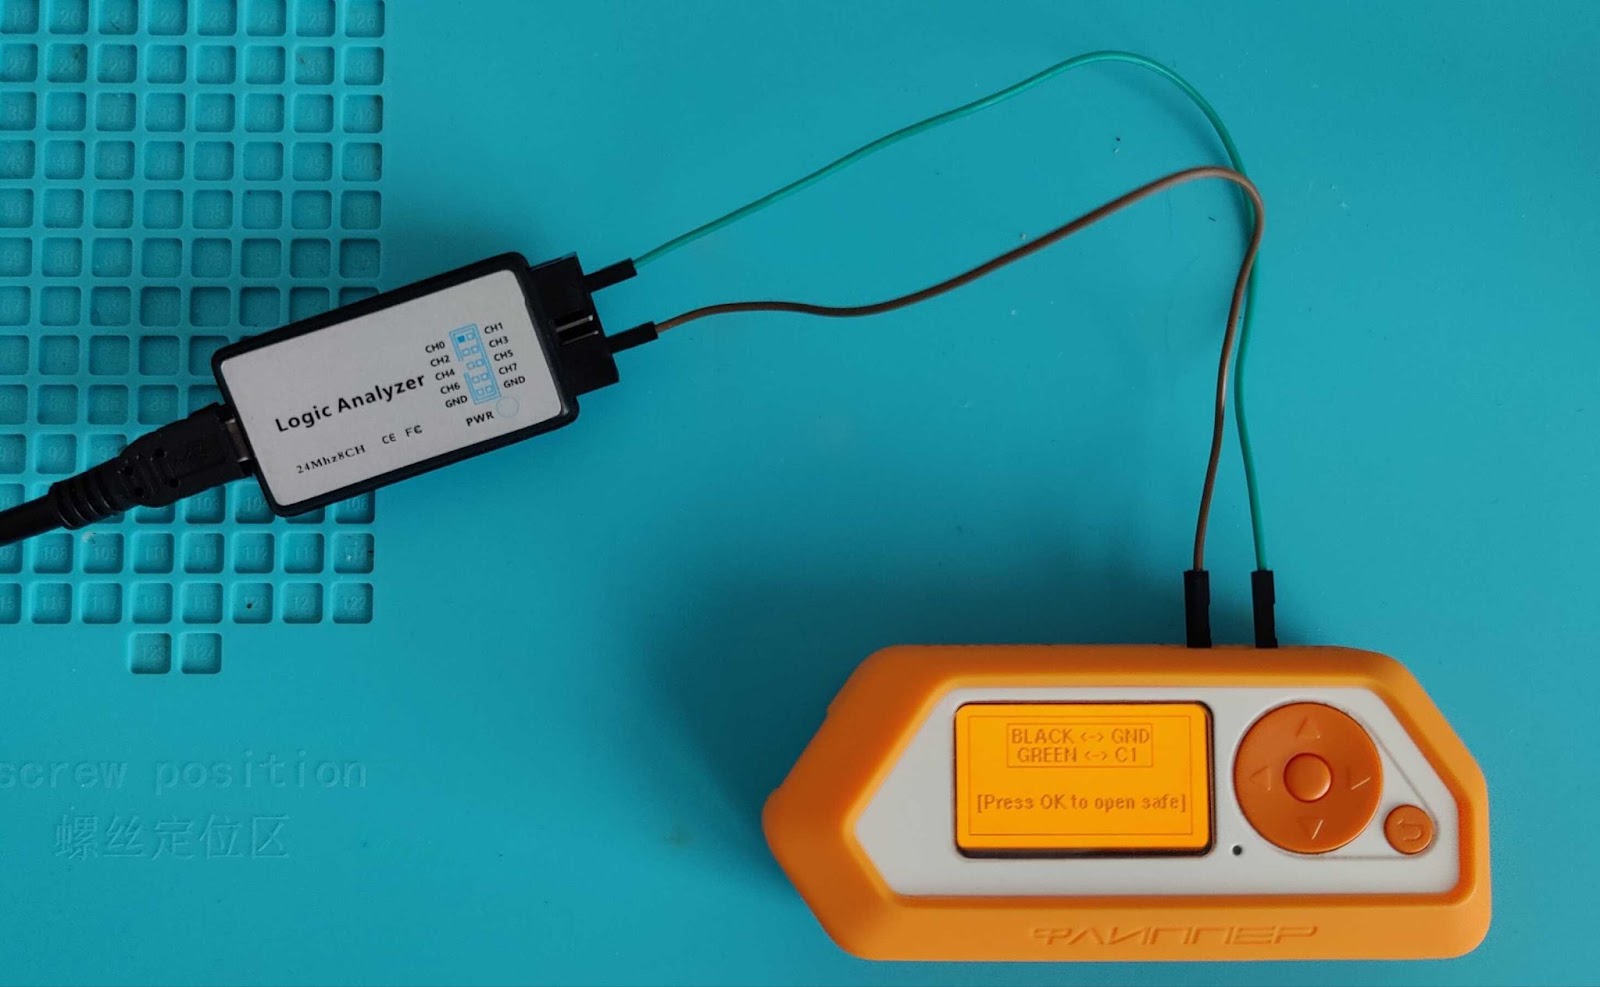
We will also need two male-to-female jumper wires to connect the Flipper Zero to the logic analyzer for capturing the exploit. The photo below shows the Flipper Zero and logic analyzer wired up together for reference.
Software for Capturing the Exploit
Since I used a budget logic analyzer here, we are also going to use the free and open source PulseView software as capture software. PulseView is the GUI frontend for Sigrok. If you are on a Debian-based Linux system such as Kali, you should be able to simply install the sigrok package from your distro’s repository system. You might also want to install the package sigrok-firmware-fx2lafw as well since this is the driver needed to access the logic analyzer.
Configuring PulseView for the Capture
Keep in mind, there is some initial setup you need to accomplish before starting the capture. A good setup can help result in a clean and meaningful capture, so you’ll want to take the time to do the configuration. A general overview of what we will want to configure is listed below:
- 1. Connect the logic analyzer
- 2. Configure PulseView to use the logic analyzer
- 3. Remove unnecessary channels from the capture configuration
- 4. Name the channel and configure a trigger
- 5. Set the number of samples
Furthermore, I would recommend doing the capture on a bare metal machine and not in a VM. I’ve had issues in the past with virtual machine USB passthrough skewing the result and since the data is only meaningful as it’s observed in the time domain, you should capture locally to avoid time skewing. Trust me, this will save you a lot of headaches trying to troubleshoot why the captured data looks wrong.
1. Connect the Logic Analyzer
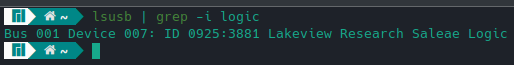
The first thing to do is plug in the USB logic analyzer to the computer and make sure it shows up on the OS side. Being on a Linux based system, I can see this using the lsusb command. The screenshot below shows the result of this command, where the logic analyzer is registering as a Saleae Logic branded device, even though it isn’t really.
2. Configure PulseView to use the logic analyzer
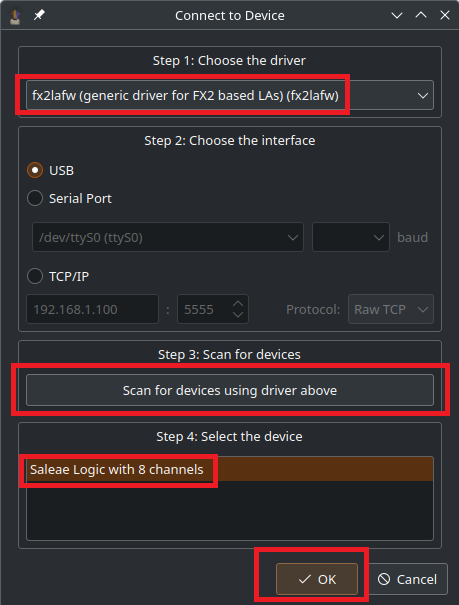
Once you confirm the device shows up in the OS, you need to configure PulseView to use it. This is done by clicking the device drop down in the top bar of PulseView, which will open a Connect to Device dialog window. For Step 1: Choose the Driver, select the option fx2lafw (generic driver for FX2 based LAs) (fx2lafw). After that is selected, click the Scan for devices using driver above button. This should populate the listview in Step 4: Select the device group with your device. Select the device and click ok. The screenshot below shows this dialog and my configuration for the capture, with the items that needed to be configured highlighted in red.
3. Remove unnecessary channels from the capture configuration
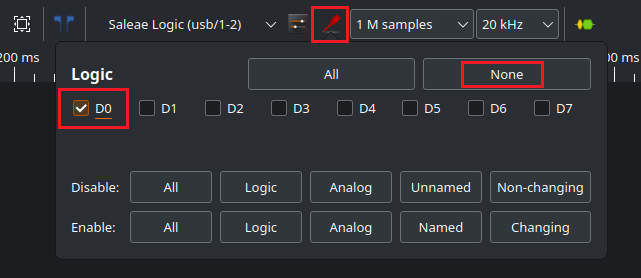
Now that PulseView is configured to use our logic analyzer, we can further configure PulseView to make the capture more useful. The logic analyzer has 8 channels, and by default, PulseView will configure all 8 channels as D0 through D7. Since we are only capturing a single channel, let’s remove the other channels to de-clutter the view. This is done by clicking the icon in the top bar that looks like a red logic probe. Clicking this icon will provide a modal dialog to configure the channels.
Considering we only have one channel of data we are capturing, we will just click on the None button to unselect all of the channels, and re-check D0. This will capture the data wired to CH0 on the physical logic analyzer. The photo below shows how I configured this dialog for the capture.
4. Name the channel and configure a trigger
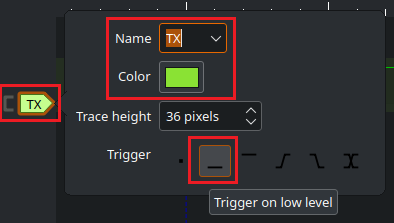
With the channel list pruned of the unnecessary channels, let’s configure the single channel in the timeline view. There should be a label for it in the timeline capture view in the main window. Clicking on a channel label will produce a modal that will allow you to change settings for it. It is recommended that you give it a meaningful name.
I chose TX since this channel is transmitting data. At the bottom there are trigger settings. Triggers can be used to configure a trigger on when the data capture will start. For this one, I choose Trigger on low level. This means when we click Run, it won’t start capturing data until this channel hits a low level.
5. Set the number of samples
The next thing you need to change is the number of samples. The default I got from PulseView with this logic analyzer was 1 million samples at a rate of 20 kHz.
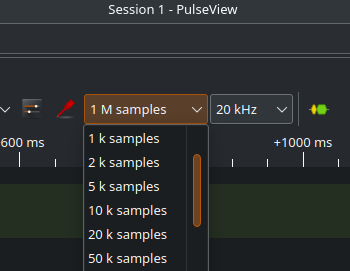
This is one area where the logic analyzer gets a little different from packet capture tools like WireShark. Instead of running continuously, we will tell it to capture a certain number of samples. Samples are a data point of where the logic level was at a given point in the time domain during the capture. The sample rate is the rate at which these samples are captured. A higher sampling rate means a better resolution into the logic state. The default rate of 20 kHz will capture 20,000 samples per second. For collecting 1 million samples at 20 kHz, we will end up capturing 50 seconds of data.
We can probably shorten the duration of the capture down since the time from pressing the ok button on the Flipper Zero to seeing the Done message in the FAP was almost instant. So we will modify the number of samples down to 20 k samples in the drop down. 20,000 samples being collected at 20 kHz will give us a 1 second long capture.
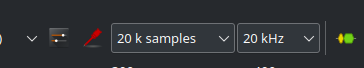
This should be fine for us seeing as we have a trigger attached to the channel to start the collection, so we have time to start it and then handle the Flipper Zero. It’s not a race against the clock thanks to the trigger. With this last change, we are ready to capture the exploit!
Capturing the Exploit
To capture the exploit, we will click on Run at the top left of PulseView. This will start the capture, but pending the trigger event before the real capture logging starts. You can tell it is running when the Run button is turned into a Stop button. With the capture running, we can now launch the Sentry safe exploit from the Flipper Zero. This will result in the trigger event starting to log the data and you will see the signal appearing on the timeline. The GIF below demonstrates starting the capture process in action.
If you are happy with the data captured, it’s not a bad idea to save the capture to the disk. Once saved, you can begin analyzing the signal.
Decoding the Signal
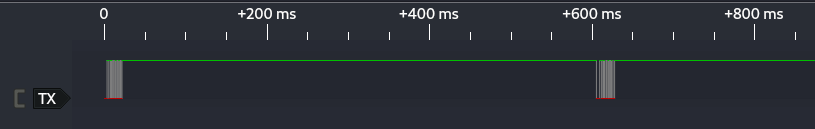
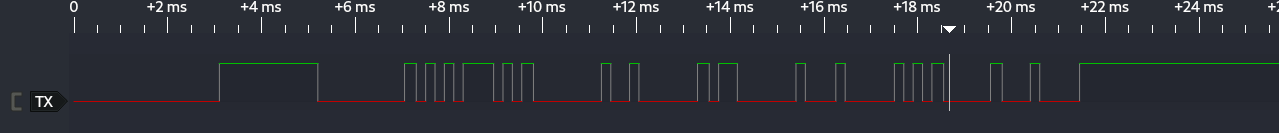
Looking at the captured timeline, we see what appears to be two packets of data. These would be the two clusters of low levels that happen on the zoomed out timeline below.
If we zoom in on one of them, we can see square waves of different sizes that show us some bits traveling across the wire. A closer look at the first packet is shown in the screenshot below.
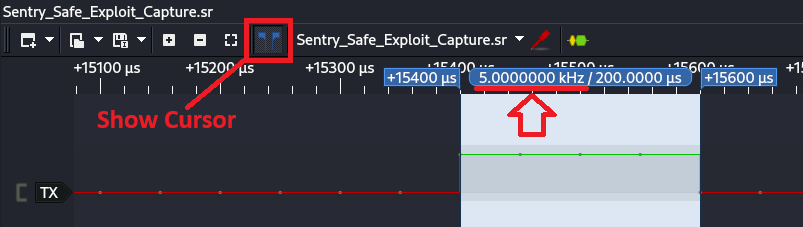
Given that there are several smaller ones there, we can measure one of the smaller peaks where there was a rapid bit flip occurring. Measuring that should give us a rough estimate of the baud rate. PulseView has a cursor feature that can be used to measure between sample points on the timeline. This is done by clicking on the icon at the top that looks like two blue cursors.
After clicking that icon, the cursors should appear on the timeline. Drag those to the edges of one of the bit flips and it should tell you the duration in microseconds, and the frequency. We are interested in the frequency shown in the screenshot below, which is 5 kHz.
If we look at a list of common baud rates, 5,000 hertz would be between the 4800 and 9600 baud rates and closest to the 4800 baud rate. With that baud rate in mind, let’s attempt to apply a UART protocol decoder. If you are wondering why we jump straight to UART, it’s because with a single line, there is no clock signal line, so that rules out protocols such as I2C or SPI, and UART is commonly used when there is no clock signal because the baud rate is mutual between the two devices.
Protocol decoders can be applied on top of a capture and attempt to break the data down into a protocol and display it in a more high level manner. PulseView even permits stacking decoders! There are several protocol decoders built right into PulseView and you can even add some yourself. However, there is already one present for UART.
First, we need to open the protocol decoder by clicking the open decoder sidebar icon at the top of PulseView. Once the sidebar is open, we can search for UART to filter the list down to the one we are interested in and apply it to our capture.

Once the protocol decoder is applied, it will appear in the timeline like a channel. We can click on this like we did with D0 to open up a settings modal. In the UART settings, we will set the baud rate to 4800 and data format to hex.

Once that is done, we can now review the contents of the data packets.
Want to go from analyzing UART to exploiting it?
Now that you have seen how to capture and decode UART traffic, the next step is connecting directly and injecting commands. Our UART series walks through everything from finding pins on a PCB to automating command injection with the Flipper Zero.
Read: Introduction to the UART InterfaceReview of the Exploit
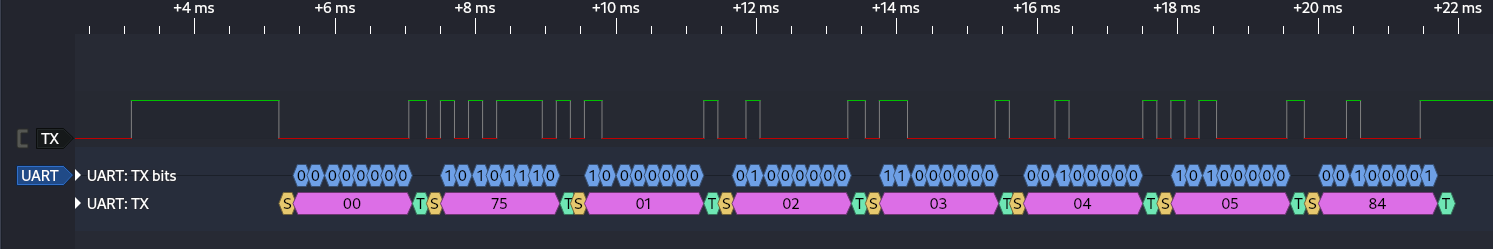
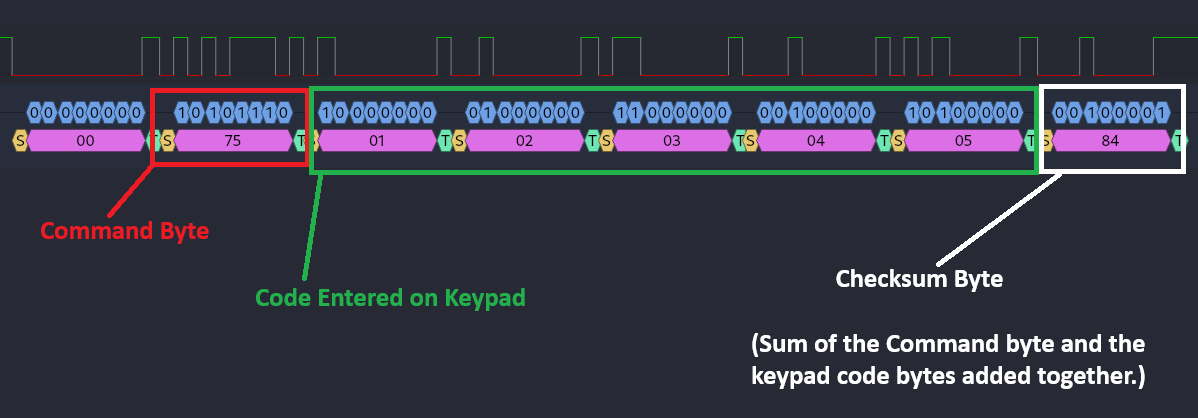
Now that the UART decoder is applied, we can zoom in on the first packet and see we get the hex bytes 00 75 01 02 03 04 05 84.
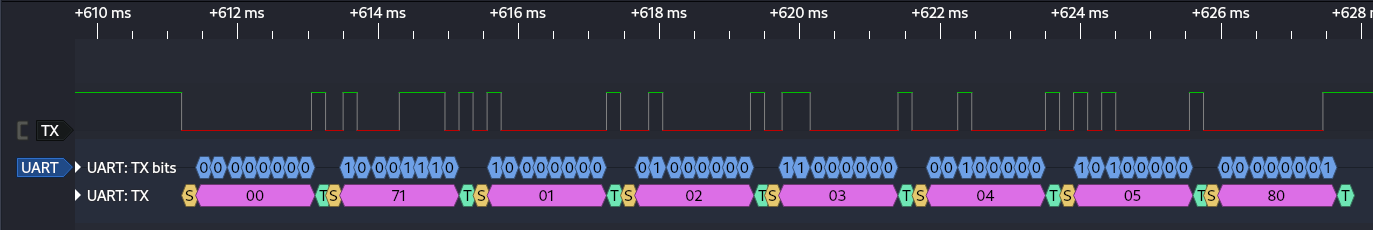
The second packet contains the payload bytes 00 71 01 02 03 04 05 80.
Since we are getting this from the exploit code, and not by analyzing a real Sentry safe keypad, we will use Hackd4ddy’s write-up to understand the packet structure. Hackd4ddy found that there is an abnormal non-standard low state for 2.7 ms, followed by a high state for 0.25 ms. He noted that this was not a part of UART, but was being carried out on the safe’s keypad traffic, and the exploit emulates this behavior.
Next it would send 0x00 as a wake-up byte. After the wake up byte, we get to the more interesting traffic which is a command byte, 5 bytes of data, and a checksum. The 5 bytes of data are the combination entered on the keypad. The checksum is the sum of the 5 bytes of data and command byte added together. So 0x71 + 0x01 + 0x02 + 0x03 + 0x04 + 0x05 = 0x80.
Hackd4ddy’s write-up contains a small table of the command bytes that were observed.

The flaw here was that 0x74 is used to start a code change, and 0x75 is used to finalize it. Hackd4ddy decided to see what happens if one were to skip 0x74 and just finalize with 0x75 via an injection attack. This is not too different from testing a multi step workflow in a web application where you check if it is possible to skip or re-order steps.
The result was that you can skip the verification step and just skip to the code change validation step and it will work. Armed with that knowledge let’s review those two packets we saw from the exploit again:
- 00 75 01 02 03 04 05 84 => Finalize the change code with a new code of 12345.
- 00 71 01 02 03 04 05 80 => Try the code 12345, this will open the safe
Conclusion
So the exploit will change the code to 12345, then try the code 12345. This is an awesome and simple exploit to learn from. A huge thank you to Hackd4ddy for the research, excellent write-ups, and publicly available tools. We also now understand that this exploit will change the safe code to 12345. This could be something to consider when using this in the wild as this will effectively change the safe code without the real users knowledge.
I hope you enjoyed today’s walkthrough and review of Hackd4ddy’s Sentry Safe exploit. If you are interested in learning more about hardware hacking, check out the Secure Ideas Professionally Evil Webcast. We have talks on a range of topics. We also release recordings of past webcasts on our YouTube channel, where we have covered using the Flipper Zero as a Hardware Hacking Tool. If you want to explore more protocols, you should also check out Sigrok’s GitHub repository of dumps.
Building or shipping hardware? Know what an attacker sees.
Logic analyzers, UART exploitation, and protocol reversing are all part of what our hardware security team does during an embedded device assessment. If your product has a keypad, a debug port, or a radio, we can tell you what is exposed.
Talk to Our Team