

Most of the time, proxying the browser doesn't present any sort of trouble. You should be able to configure it the way you did on day one and use it exactly as intended. However, a handful of times I've had to pentest a web app that I couldn't capture with the proxy. For the first couple years that I did full-time penetration testing, I occasionally found HTTP Public Key Pinning (HPKP) in use on a target application. If you're not familiar with it, HPKP is similar to certificate pinning on a mobile app, but done for a web app. The world has generally moved on from the idea of HPKP, as a lot of organizations break TLS encryption to inspect traffic for data-loss prevention purposes and HPKP-enabled apps wouldn't be able to serve those orgs. Still, I've encountered apps where, due to the particular niche of the industry they were in, there were stringent controls against proxying, using virtualization software, or otherwise inspecting the traffic with anything except the browser's devtools.
Configuring DevTools for Testing
My examples for this use a version of Firefox, but these settings are available in most current desktop browsers (including at least Chromium, Firefox, and Safari), although how they're presented will vary slightly. The default behavior for the devtools is to clear the Network tab each time you refresh a page, so the first thing you want to do is make sure they're persisted as you navigate around. In my picture below, it's the gear icon in the top-right of the devtools, and then the option called Persist Logs.
.webp)
Chromium has a checkbox for Preserve Log instead, which works the same way. When selected, the history that's captured on the Network tab will only be cleared if you manually clear it with the clear button (looks like a cancel symbol). This means you can completely map the application, like I've done below.
Now for the part that relates to ZAP...
Import a HAR File into ZAP
You can save your traffic as a HAR (HTTP ARchive) file, which is a JSON representation of the request and response data. As shown below, in Firefox it's an option on the same menu where the Persist Logs option was found on the Network tab. You can also right-click the traffic table itself and find the Save All As HAR option on the context menu.
.webp)
Once you save that traffic capture to disk, you can load it into ZAP with the Import HAR option, found on the Import menu of the main menu bar.
-4.webp)
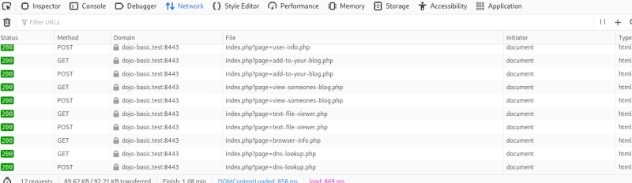
Once it's loaded, it fills in the sitemap on the Sites tab, the history on the History, and the Alerts passively detected from the traffic. For all intents and purposes it's as though you proxied the traffic through ZAP the whole time.
-2.webp)
This opens up options to use the Requester, Request Editor, Fuzzer, etc from within ZAP.
Fuzzing from the JS Console
While not really a ZAP-specific option (although if ZAP's Fuzzer works for you, that's the better choice), you can use JavaScript on the DevTools script console to fuzz if you need to. I have open-sourced a script I wrote for it: https://github.com/mgillam/evil-browser-toolkit
I demoed it at an OWASP Jacksonville meeting in 2021, which was recorded and is available here (the section demoing this script starts at about 35 minutes).
Basic Usage
Using a Chromium browser (a few features only work in Chromium), paste the main.js into the devtools console and run it, noting that you should read through and understand it first since self-XSS is a thing. This instantiates an object called penTools in the window's global context.
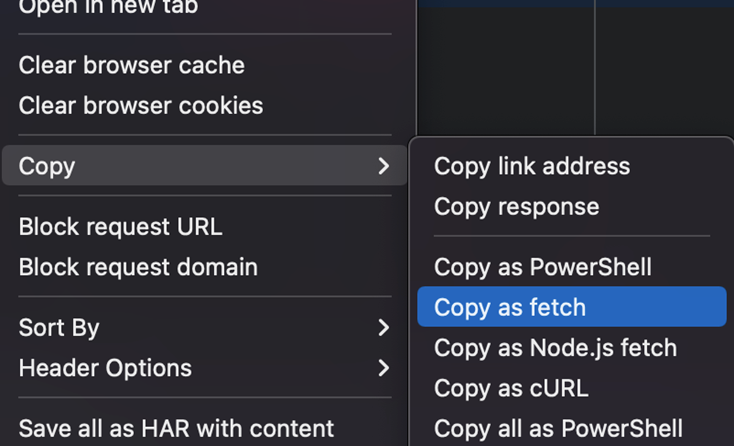
Next, you can go to the Network tab, find the request you want to fuzz, right-click the request in the list and Copy as fetch from the context menu as pictured.
Now switch back to the Console tab and enter a variable assignment to penTools.fuzz.<paste your fetch> so your input should look like the following:
-4.webp)
This sets up the fuzzer object. Next you can use fuzz1.setWordList or fuzz1.loadWordList to get your list of payloads into place, the distinction being loadWordList loads them from a file, setWordList takes them as an argument.
fuzz1.setWordList(['1','2','3']); /* or */ fuzz1.loadWordList();
Next, you specify where in the request you want to fuzz. For URL or route parameters, the syntax is:
fuzz1.fuzzUrl("http://localhost:3001/team/${param.teamId}", { teamId: 3 });
Note the template literal syntax appearing in a regular (not template literal) string. For body parameters, an array of parameter names will suffice.
fuzz1.fuzzBodyParams(["assigned_to"]);
Once you've specified your word list and fuzz locations, you can run it with fuzz1.run(). They're also set up as a chainable (fluent API) structure, so you can do something like the following:
fuzz2.fuzzBodyParams(["assigned_to"]).setWordList(['1','2','3','4','5','6','7','8','9']).run({ throttle: 250 })
In Summary
A bit of this went outside of ZAP's workings, but the key takeaways are that the vast majority of the time you can use the proxy, and it's always the better option to do so. However, if you find yourself in the edge case where you absolutely can't proxy through ZAP, you can still map with the browser and export your mapping from the devtools. ZAP's ability to import a HAR file makes it especially well equipped for this situation. From there, you can probably replay and fuzz from ZAP. But if you really need to, there are options to do both from within the browser.
Need help testing an application with complex proxy requirements?
Our team has tested applications across every kind of environment, from standard web apps to certificate-pinned and heavily controlled setups. Reach out to discuss a security assessment.
Talk to Our Team